Institute Solar Fuels
Thermal analysis
Differential thermal and thermogravimetric analysis (DT-TGA)
To study synthesis in the process of catalyst´s formation and thermal behavior and stability of materials in multinary systems and especially of photosensitive compound semiconductors used for light-driven water splitting differential thermal and thermogravimetric analysis (DT-TGA) are applied. For these investigations crucibles such as aluminum oxide or platinum are filled with the substance to be investigated, placed on a ceramic holder in a tubular furnace and heated under argon or air gas flow. The furnace is at one side attached to a balance and at the opposite side coupled to a quadrupole mass spectrometer via a skimmer.
This technique allows the simultaneous recording of temperatures of solid-solid phase transition (e.g. melting points or structural changes) as well as to investigate the thermal stability of the materials in the attached balance as a function of temperature. It can also be used to study the process of compound formation heating selected precursor mixtures in suited gas atmospheres (Fig.1).
Thermal analysis is frequently applied to provide x-T phase diagrams (Fig. 2) from Differential-Thermal-Analysis (DTA) traces by heating e.g. mixtures of pre-synthesized precursors in small, evacuated and sealed quartz glass ampoules fixed in platinum crucibles. Using this technique also homogeneity ranges of compounds can be determined which is of general interest to understand the electronic behavior of semiconducting compounds.
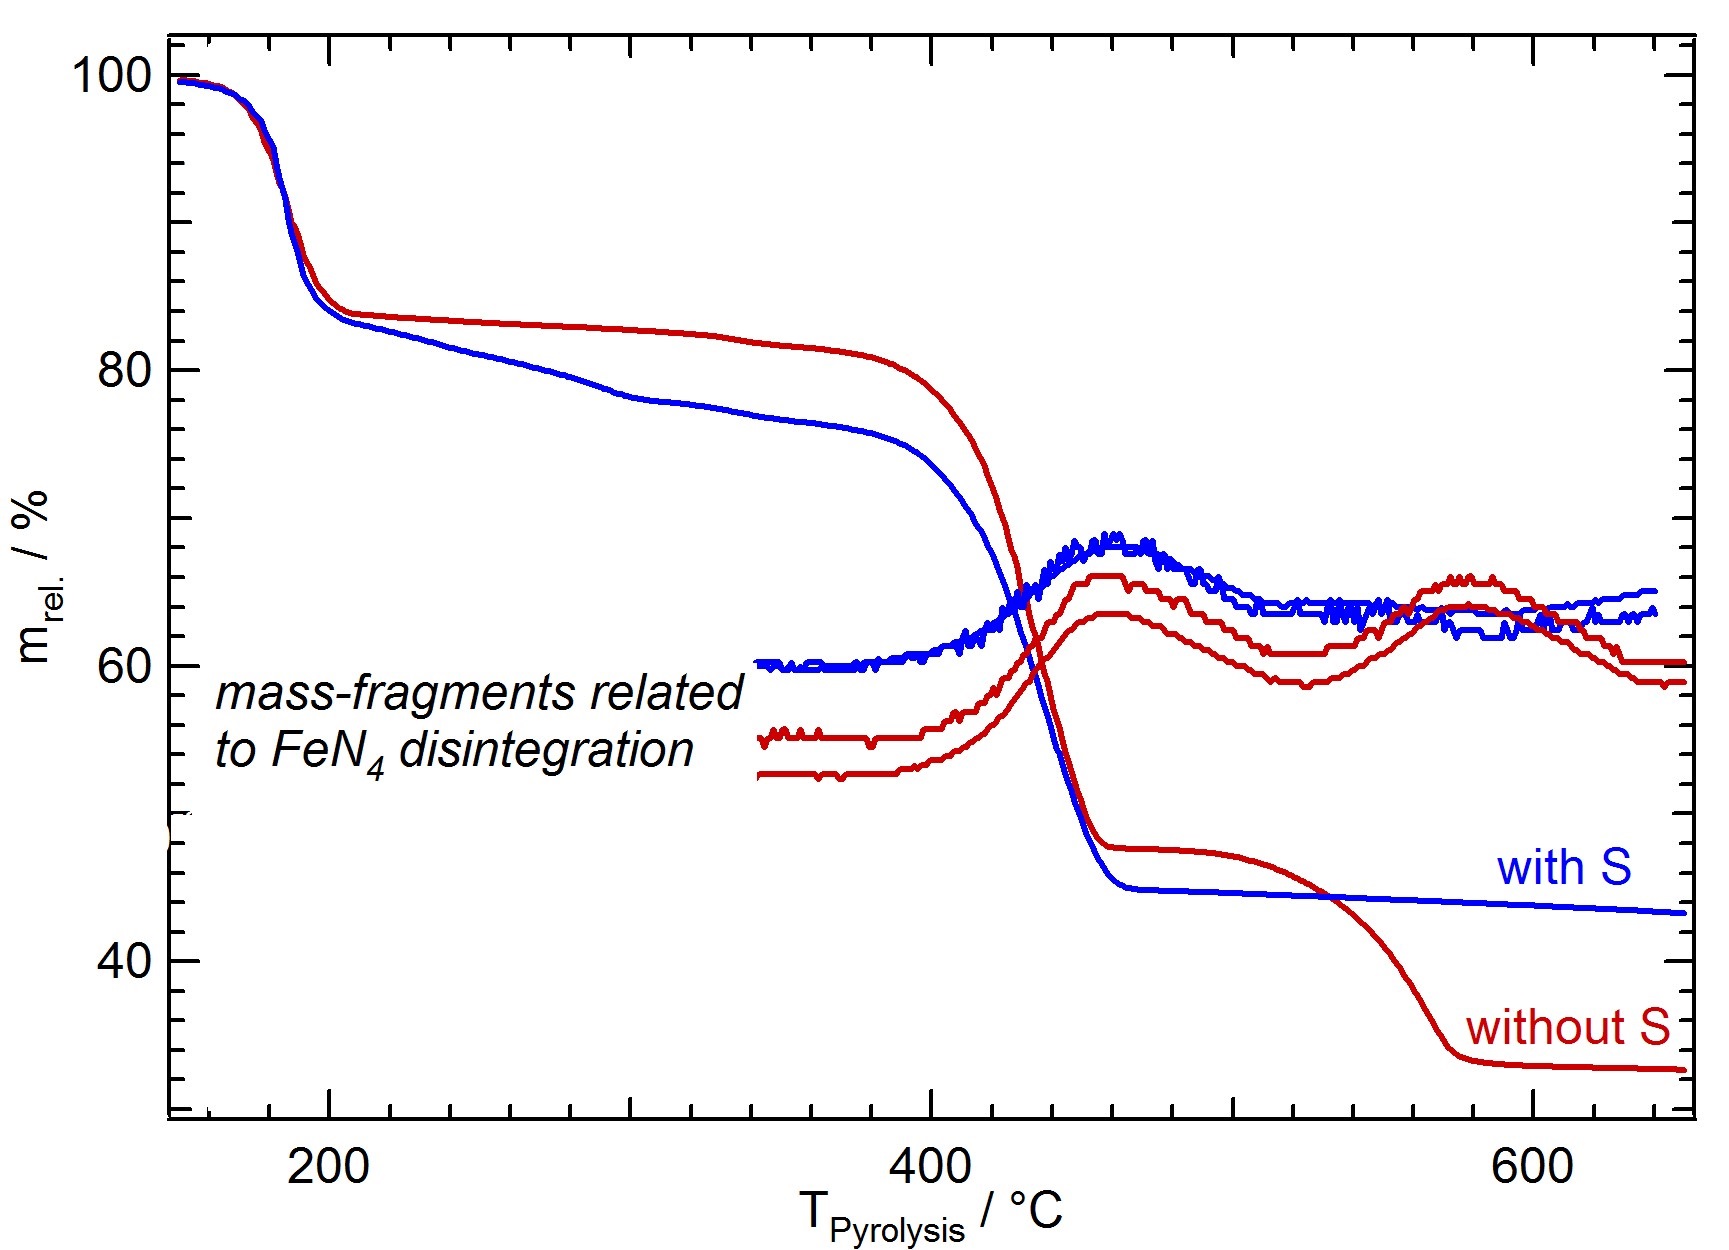
Fig. 1.
Thermogravimetric curves of iron porphyrin/iron oxalate mixtures with and without sulfur added to the precursor heated to 920°C. From the course of the curves analyzing the released gasses by a mass spectrometer in addition reaction intermediates can be detected leading to an optimized catalyst performance [1].
©HZB/Fiechter
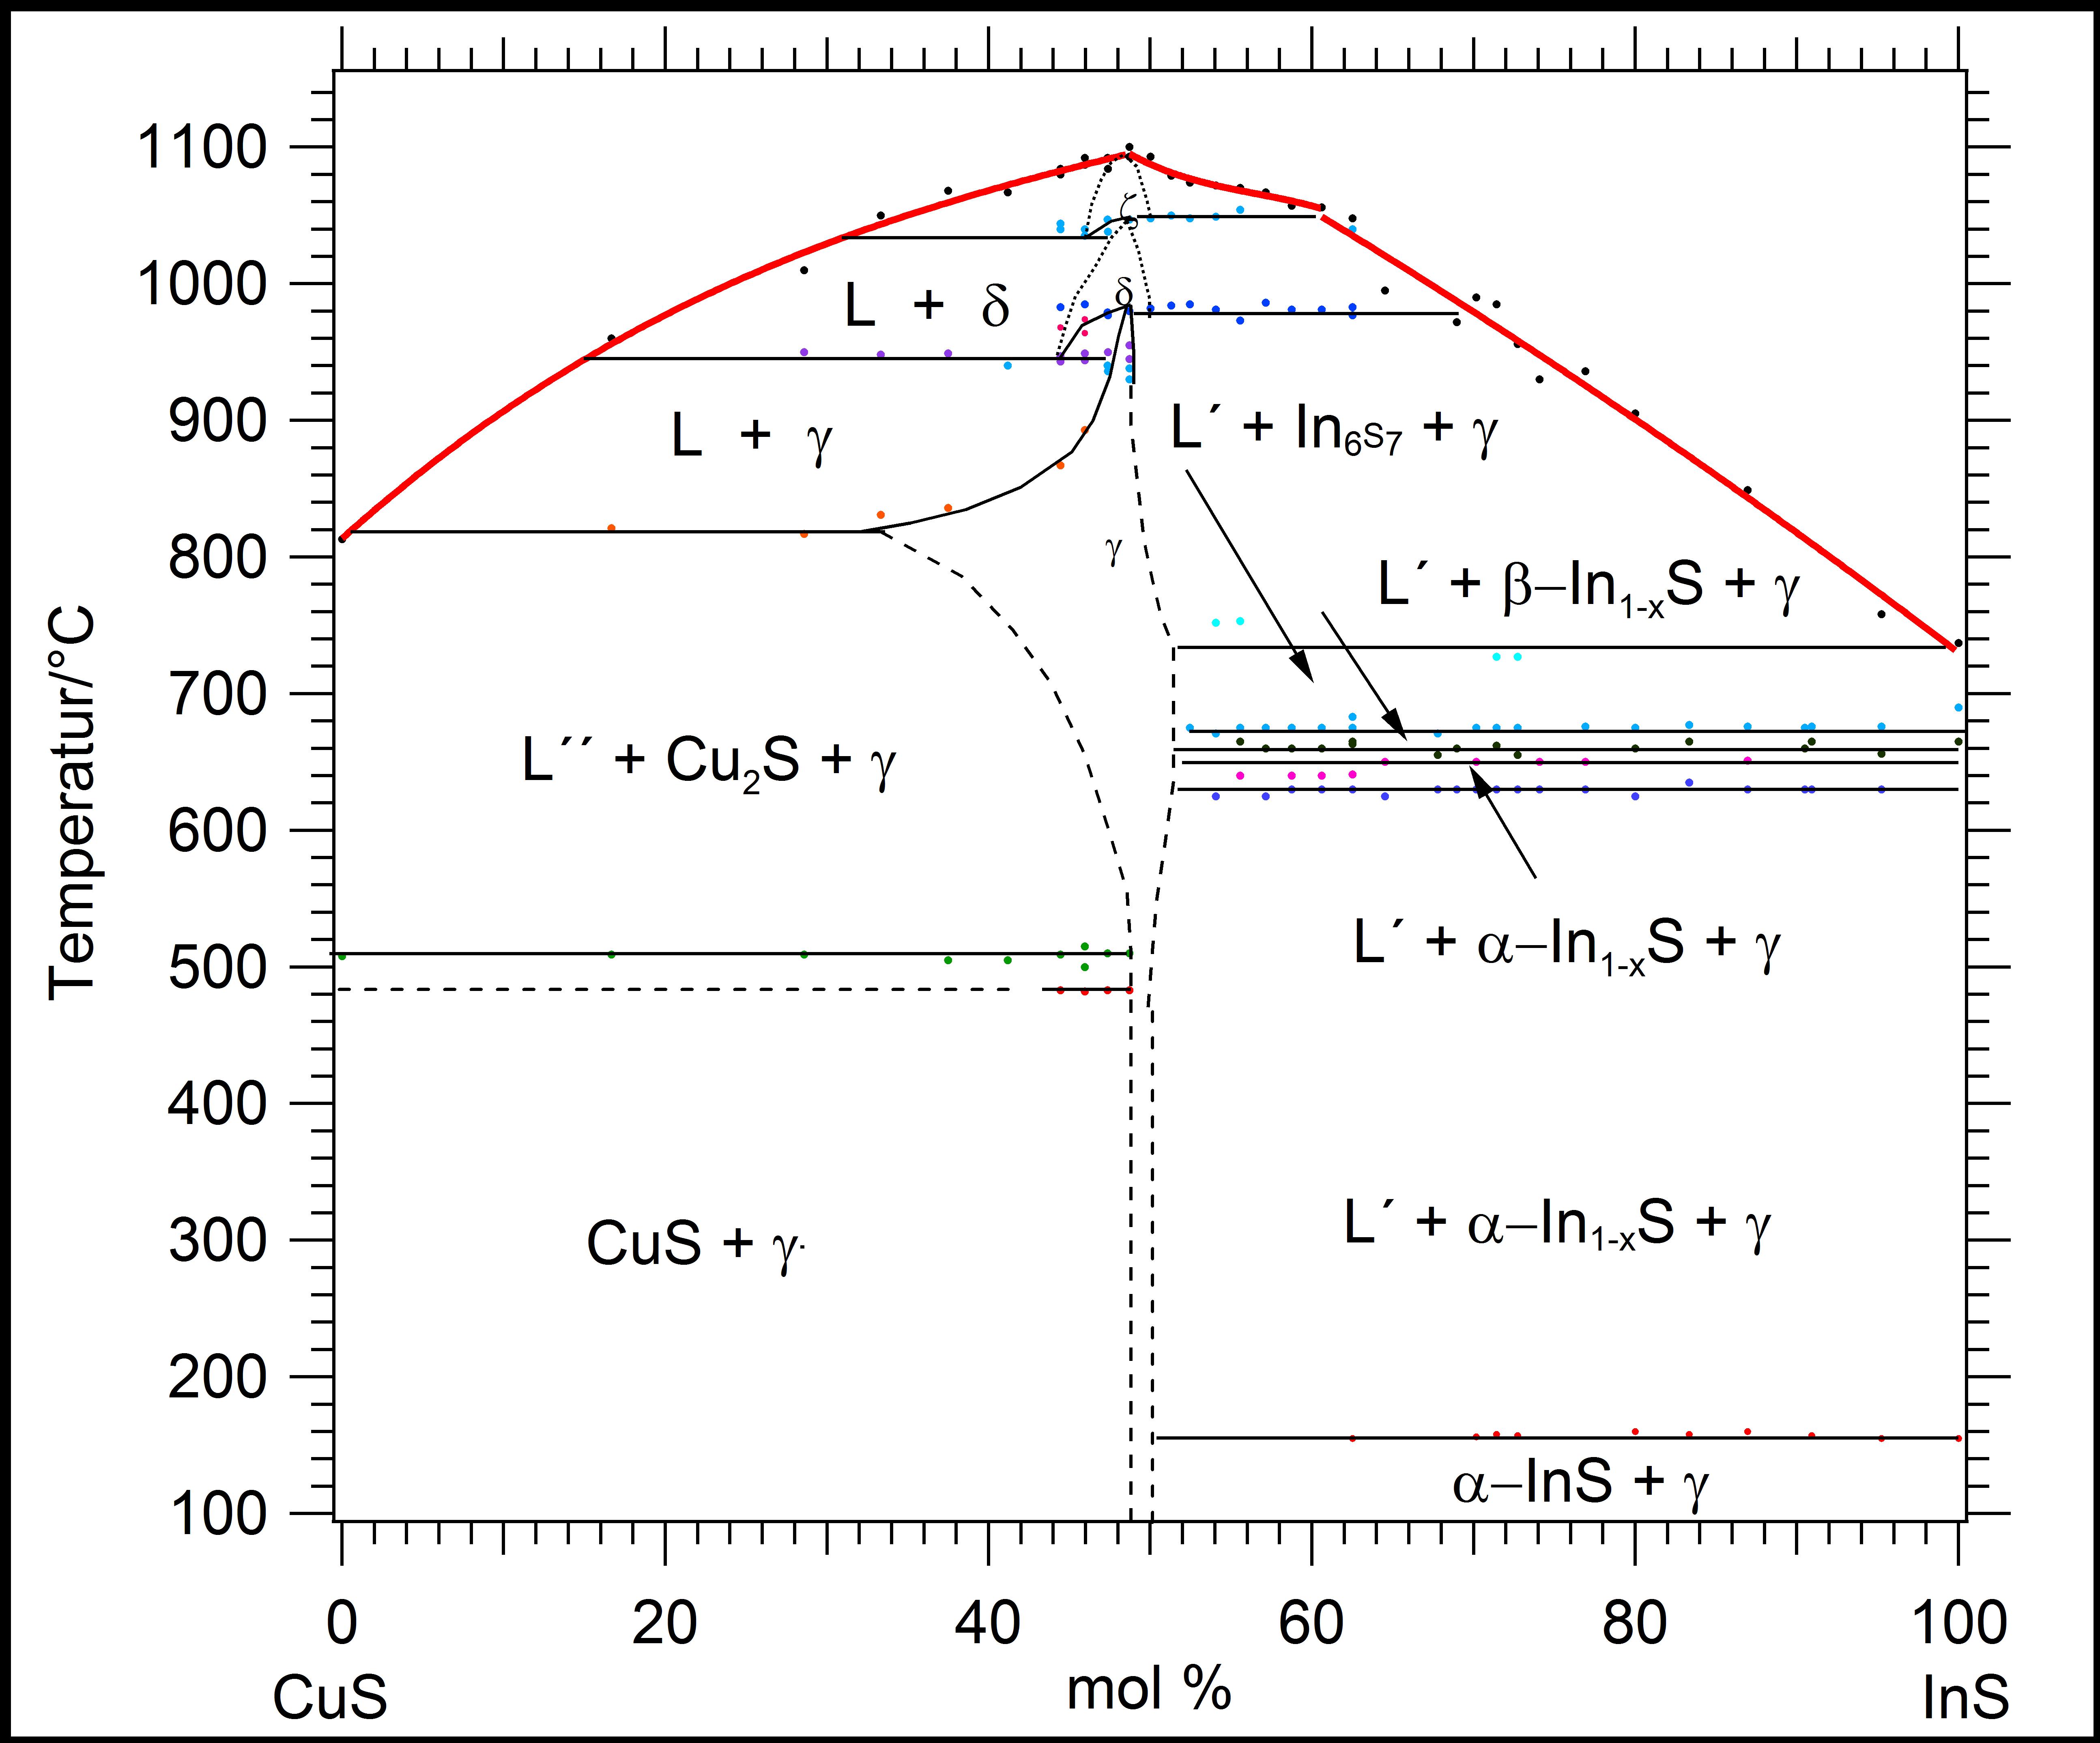
Fig. 2.
Pseudobinary phase diagram CuS–InS. Below the melting point of Cu1-xIn1-yS2 (~50 mole % CuS) at 1095°C the z-phase appears, crystallizing in the wurtzite structure. At 1047°C the wurtzite-type phase transforms into a zincblende-type one (d-phase). Ordering of the cation sublattice at 983°C leads to the chalcopyrite representative roquesite (g-phase). The three modifications of CuInS2 exhibit capped-type existence fields [2].
©HZB/Fiechter
References
[1] U.I. Kramm, A. Zana, T. Vosch, S. Fiechter, M. Arenz, D. Schmeißer: “On the structural composition and stability of Fe–N–C catalysts prepared by an intermediate acid leaching”, J. Solid State Electrochem. 2016, 20, 969-981
[2] S. Fiechter; Y. Tomm, M. Kanis, R. Scheer, W. Kautek: „On the homogeneity region, growth modes and optoelectronic properties of chalcopyrite-type CuInS2”. phys. stat. sol. (b), 2008, 245, 1761-1771